
Execution
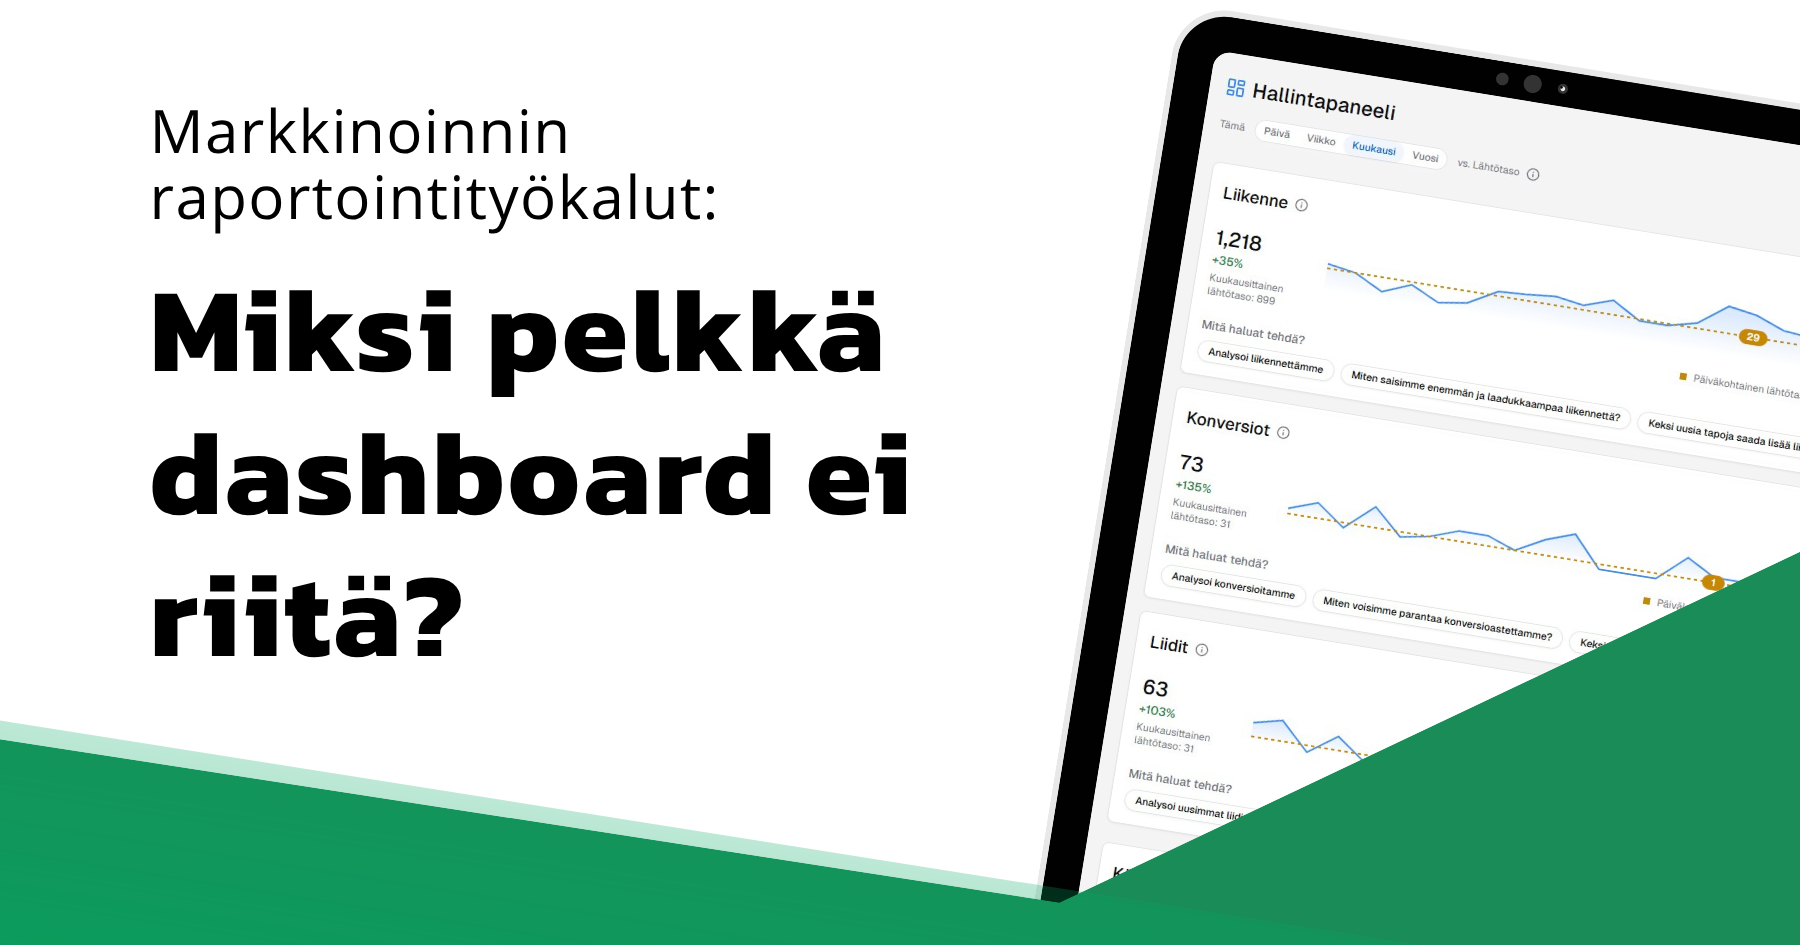
Marketing reporting tools: why a dashboard alone is not enough
A dashboard tells you what already happened, not what to do next. Here is how a B2B company moves from marketing reporting to guiding customer acquisition.
In many B2B companies, marketing reporting looks active, yet it does not answer the most important question of all: which marketing actually brings in new customers?
Marketing reporting is often difficult because the data is scattered across numerous systems. Google Ads shows one number, Meta another, and LinkedIn a third. At the same time, Google Analytics 4 (GA4) describes web behaviour but may reveal nothing about lead quality. Add a CRM that shows how sales progress but not always where the best demand originally came from, and the overall picture blurs quickly.
In this article we go through why a traditional marketing reporting tool or a static dashboard is not enough on its own, and what a B2B company should actually measure.
What do marketing reporting tools usually do?
Marketing reporting tools have traditionally been designed to make collecting and visualising data easier. They gather the numbers from different channels into one place, automate the creation of monthly reports, and help track budget spend, traffic, and conversions.
This makes it easier to present marketing results, but tools differ greatly in how deeply they actually see into the business.
Web analytics
Shows website traffic and conversions. Limitation: does not always reveal lead quality.
Ad platforms
Show campaign-level results. Limitation: channel-specific view.
Dashboard tools
Gather data into a single view. Limitation: do not necessarily guide decisions.
CRM
Shows how sales progress. Limitation: does not always connect to marketing data.
Customer acquisition guidance system
Connects marketing and sales data. Limitation: requires a clear metrics model.
Why is a marketing dashboard alone not enough?
The biggest problem in leading marketing today is not a lack of data. The biggest problem is that the data does not guide decisions.
A traditional marketing dashboard is like a car’s rear-view mirror: it tells you precisely what has already happened. It shows impressions, clicks, and the conversions that accumulated yesterday. It does not, however, tell you why this happened, nor does it automatically tell you what you should do next.
Reporting is about understanding the past, while guidance is about making the next decisions based on data. If marketing and sales data do not come together, customer acquisition reporting is left half-finished. Even if the dashboard shows a hundred leads, it does not tell you whether they led to proposals or deals. At worst, the wrong marketing reporting tool simply adds more data and charts without improving marketing ROI.
What should a B2B company actually measure?
Measuring B2B marketing requires a clear framework that covers the entire customer journey, from first touch to closed deal. Marketing reporting needs to reach at least the quality of the lead — preferably all the way to the deal.
Here is a model on which effective marketing metrics are best built:
1. Visibility
- Impressions
- Organic rankings in search engines
- Growth in branded searches
- Content reach
2. Traffic
- Users and sessions
- Traffic sources (which channels bring the best traffic?)
- Engagement rate
- Views of the most important buying-journey pages
3. Conversions
- CTA clicks (Call to Action)
- Form starts and submissions
- Demo bookings
- Analysis requests
4. Lead quality
- Role / title (does it match the ideal customer profile?)
- Company size and industry
- The customer’s real need and buying potential
- Fit with the company’s goals
5. Sales impact
- MQL (Marketing Qualified Lead) → SQL (Sales Qualified Lead)
- SQL → Proposal
- Proposal → Deal
- Customer lifetime value (LTV) and customer acquisition cost (CAC)
- LTV/CAC ratio
How to choose the right marketing reporting tool?
When you are choosing a new tool or evaluating your current one, go through this checklist. It helps separate static reports from genuine guidance systems.
- Can I see the most important channels in one place?
- Does marketing data connect to CRM or sales data?
- Can I see directly which sources produce the highest-quality leads?
- Does the reporting separate quantity from quality?
- Can I see which channels or campaigns the budget should be shifted to?
- Do I get recommendations based on the data, or just numbers?
- Does the reporting support decision-making weekly, not just once a month?
- Can sales give feedback on lead quality through the system?
- Can I see the real impact of campaigns on the sales pipeline?
- Does the tool help me decide what to do next?
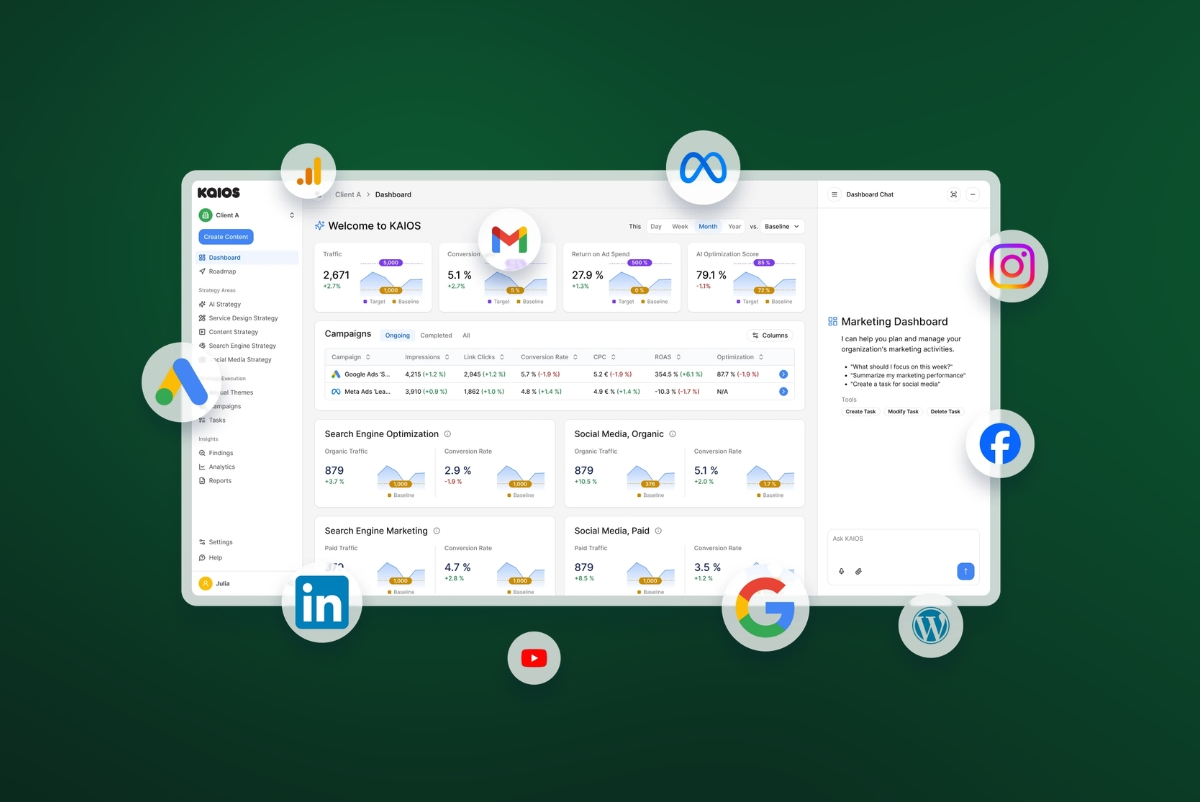
KAIO’s perspective: from reporting to guidance
KAIO is not just a marketing reporting tool. It is a customer acquisition guidance system.
We believe that simply staring at data is not enough. That is why KAIO connects marketing and sales data (Google Ads, Meta, LinkedIn, GA4, Search Console, and CRM) into one coherent picture. We help you identify exactly what works in customer acquisition, where potential is being lost, and where the budget should be invested next.
When you understand the sources of your leads and their real quality, decision-making accelerates. KAIO automates reporting and provides AI-based recommendations for the next actions. This gives marketing and sales a shared, transparent view of the situation, and lets you move from staring at the rear-view mirror to continuously guiding customer acquisition. This is how we have helped companies such as Satron Instruments build measurable growth.
Want to see what your marketing actually produces?
Stop guessing and move to data-driven decision-making. Take a free KAIO analysis to get a clearer picture of which channels, content, and actions truly move your customer acquisition forward.
Continue reading
Execution
Data-Driven Customer Acquisition: How Do You Know Which Marketing Actually Brings Customers?
Clicks and lead volume do not yet reveal which marketing grows sales. Data-driven customer acquisition connects marketing and sales data so decisions are based on what truly creates customers.

Execution
How to Build a Data-Driven Customer Acquisition System
Most companies do marketing, but few can answer one simple question: which action actually generates new customers? Data-driven customer acquisition transforms reactive activity into proactive guidance.
Execution
Does Your Content Generate Customers? Build a Data-Driven Content Production Engine
It is not about the volume of activity but about targeting. Data-driven content production directs resources to actions that have genuine business impact.
Ready to Outpace the Market?
KAIO helps guide sales and marketing with data toward better results.